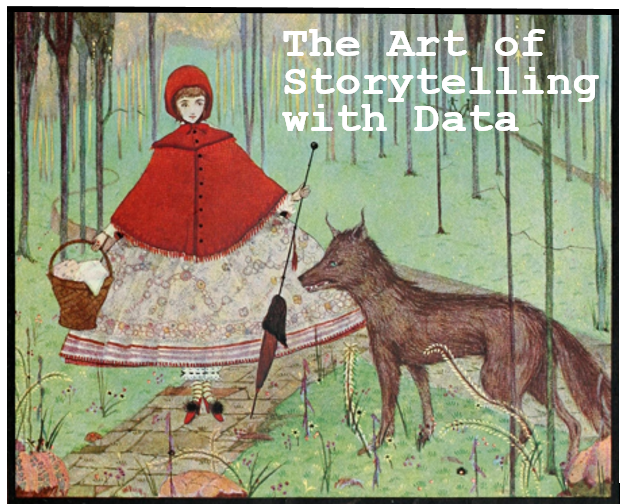
People enjoy stories. Everyone likes listening to stories, reading stories, and watching stories unfold on TV or at the movies. Stories are the natural mode in which the brain processes information. At a fundamental level, stories are what make us human, and we can use stories to purposely increase engagement when we communicate with others – making them more likely to trust, understand, and remember us. The principle of storytelling engagement applies not only to individuals, but also to businesses. Storytelling is a powerful communication tool that businesses need to examine more closely. As Jonathan Gottschall noted in his book The Storytelling Animal: How Stories Make Us Human, “We are, as a species, addicted to stories. Even when the body goes to sleep, the mind stays up all night, telling itself stories.”
The Science Behind Storytelling
When we listen to presentations with boring bulleted points, certain parts of the brain get activated.

Scientists call these areas Broca’s area and Wernicke’s area. Overall, these areas engage the language processing parts of the brain that decode words into meaning. However, when storytelling is involved, our brains become more stimulated. On the onset of a story the brain initially engages the Broca and Wernicke areas just as if it were listening to someone read a bulleted list of items, but as the story becomes progressively more engaging, other areas of the brain, such as the motor, sensory, and frontal cortices light up.
It’s possible to stimulate many parts of the brain with a well-told story. This is possible because, when listening to a story, in addition to the language processing parts in the brain becoming active, other parts of the brain that would be used if we were actually experiencing the events of the story become active as well. With this level of brain activity, people are more intellectually and emotionally invested in the story and the storyteller. Because people are experiencing a more profound brain event, they enjoy the experience more, understand the information at a deeper level, and retain the information for a longer period of time. With this knowledge, businesses can develop a firmer connection with clients and even prospective clients by telling them the story behind their company’s data.

Telling Stories with Data
All business and sales associates know that a good story resonates with clients. Stories help bridge the distance between quantitative data and people who must make difficult business decisions based on an

analysis of data. Michael Bostock, the data visualization and storytelling guru, notes that visualizations are how you can go about making an “abstract idea more concrete.” The core data used to create your visualizations can then act as the foundation of your story. The story, like a novel, is the main drive of information – pictures or visualizations are merely decorative. The story is what makes clients care about and engage with your data. In fact, stories are the most effective way to contextualize data and interact with clients on an intellectual level. Structured narratives are sense-making devices that explain the over-arching patterns of data to clients. That’s why an over-reliance on data visualizations can hurt businesses when it comes to satisfactorily explaining data. Visualizations are excellent tools for data analysis, but visualizations are not self-contained explanations of data, although they can be an important step in understanding a set of data. Introducing a good story on the heels of your visualizations can work wonders in explaining data and eliciting trust in your business and data analysis skills.
Tips for Creating Customized Stories for Clients
- Identify the audience. As a storyteller, you naturally adjust your stories to fit your audience. When telling a story to a client you’ve just met, you use different wording and insert more explanatory information than if you were telling the same story to a colleague.
- Identify how you will structure the story – focus on the data points will you emphasize to your clients. Bostock urges data scientists (and data storytellers) to ground their data examples and explanations with facts, noting that “By demonstrating real-world usage, you strengthen the argument” and the story.
- Use visualizations to complement your story, but not to tell your story. Analytics tools are now ubiquitous, and so are visualizations, especially bar graphs, pie charts, tables, and line graphs. These tools focus on data exploration, not on explaining data or in creating an engaging,
 meaningful story.
 - Use fresh data.
- Reveal patterns. Patterns help explain data and illuminate what is special about each data set.
- Remember best-selling author and marketer, Seth Godin’s wise assessment that “Marketing is no longer about the stuff that you make, but about the stories you tell.”
Storytelling with SlashDB
SlashDB has made it our mission to make data retrieval a highly accessible, searchable, and intuitive process. Unlike data extracts, SlashDB API is an automated, live link to your business’ databases, allowing for faster and the most up to date access to data, so you can construct the most relevant and engaging story.
Contact us at SlashDB and we’ll work with you to find the best API add-on configuration for your business and storytelling needs.

